
The bottom line
The goal of data management is not to “store it”, but to make the data answer concrete questions: is this coating acceptable? Is the process stable? Which step is degrading?
The five links of the data chain
| Link | Content | Tool |
|---|---|---|
| Collect | Point-by-point, reading by reading | Instrument measurement and storage |
| Identify | Point number and location | Record sheet, location sketch or photo |
| Statistic | Average, extremes, standard deviation, distribution ratio | Instrument statistics or PC software |
| Decide | Conclusion per referenced standard or project spec | Acceptance rule (e.g. 80/20) |
| Archive | Stored together with instrument status and conditions | Electronic data + paper records |
A complete data unit
A traceable data unit contains at least: point number, location description, reading sequence, point average, measurement date, instrument serial number, instrument calibration status, environmental conditions, correction method (whether BMR was done) and the measurer. Missing any one of these lowers the usability of the data.
How to use the statistics
| Statistic | Use | Abnormal signal |
|---|---|---|
| Average | Decide if the whole meets spec | Average below the nominal thickness |
| Minimum | Identify danger points | An obvious low outlier appears |
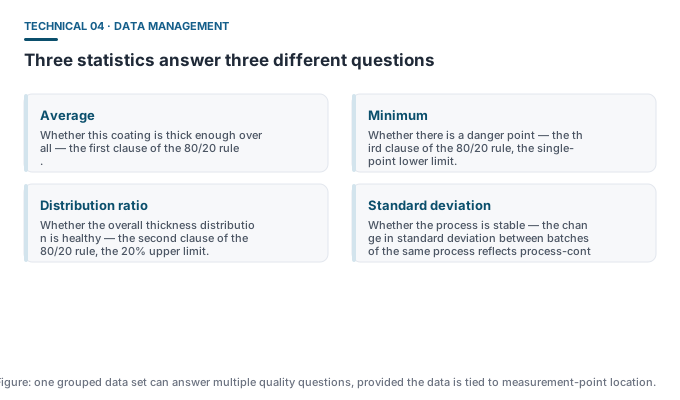
| Distribution ratio | Assess thickness distribution | Too high a share falls in the 80%-100% band |
| Standard deviation | Assess process stability | Standard deviation rises between batches of the same process |
The value of long-term data: trend analysis
For repeat production or long-term monitoring, a single batch answers only “pass or fail”, while consecutive batches answer more critical questions:
- Process drift: changes in spraying parameters show up slowly in the average;
- Equipment ageing: a rising standard deviation is often an early signal of equipment condition;
- Corrosion rate: wall-thickness monitoring relies on the historical series at the same point;
- Supplier comparison: the incoming coating thickness distribution reflects upstream process level.
Notes on wireless and export functions
Some models offer data export or wireless transmission. Two points need attention when using these functions:
- Compliance: products with a wireless module need FCC certification to be sold in the US; confirm certification status when purchasing;
- Data integrity: exported data should still keep the original measurement records and point identifiers, to avoid untraceable “reprocessed data”.
Common misconceptions
- “The instrument auto-stores, so no handwritten record is needed” — the instrument cannot record point location, conditions or correction method.
- “Average meeting spec is enough” — the acceptance rule requires looking at distribution and minimum together.
- “Stored data is always useful” — data without identifiers and condition information cannot be explained afterwards and has limited value.